My first infographic made with Piktochart
|
|
|
My first infographic made with Piktochart:
I decided to make an infographic with the app Piktochart, a free app available on iPad, iPhone, android, and online. This app is described on the App Store as "This app comes with the essential functions to create, download and publish your own visuals. Features include: templates for creating infographics, posters, presentations and reports, ability to edit, save and publish your graphic through various media platforms, available customizable elements like text, photos, shapes, and icons." It is easy to use, with a built-in beginner tour that highlights the use of different tools and elements. A helpful tutorial on how to use this app can be found here.
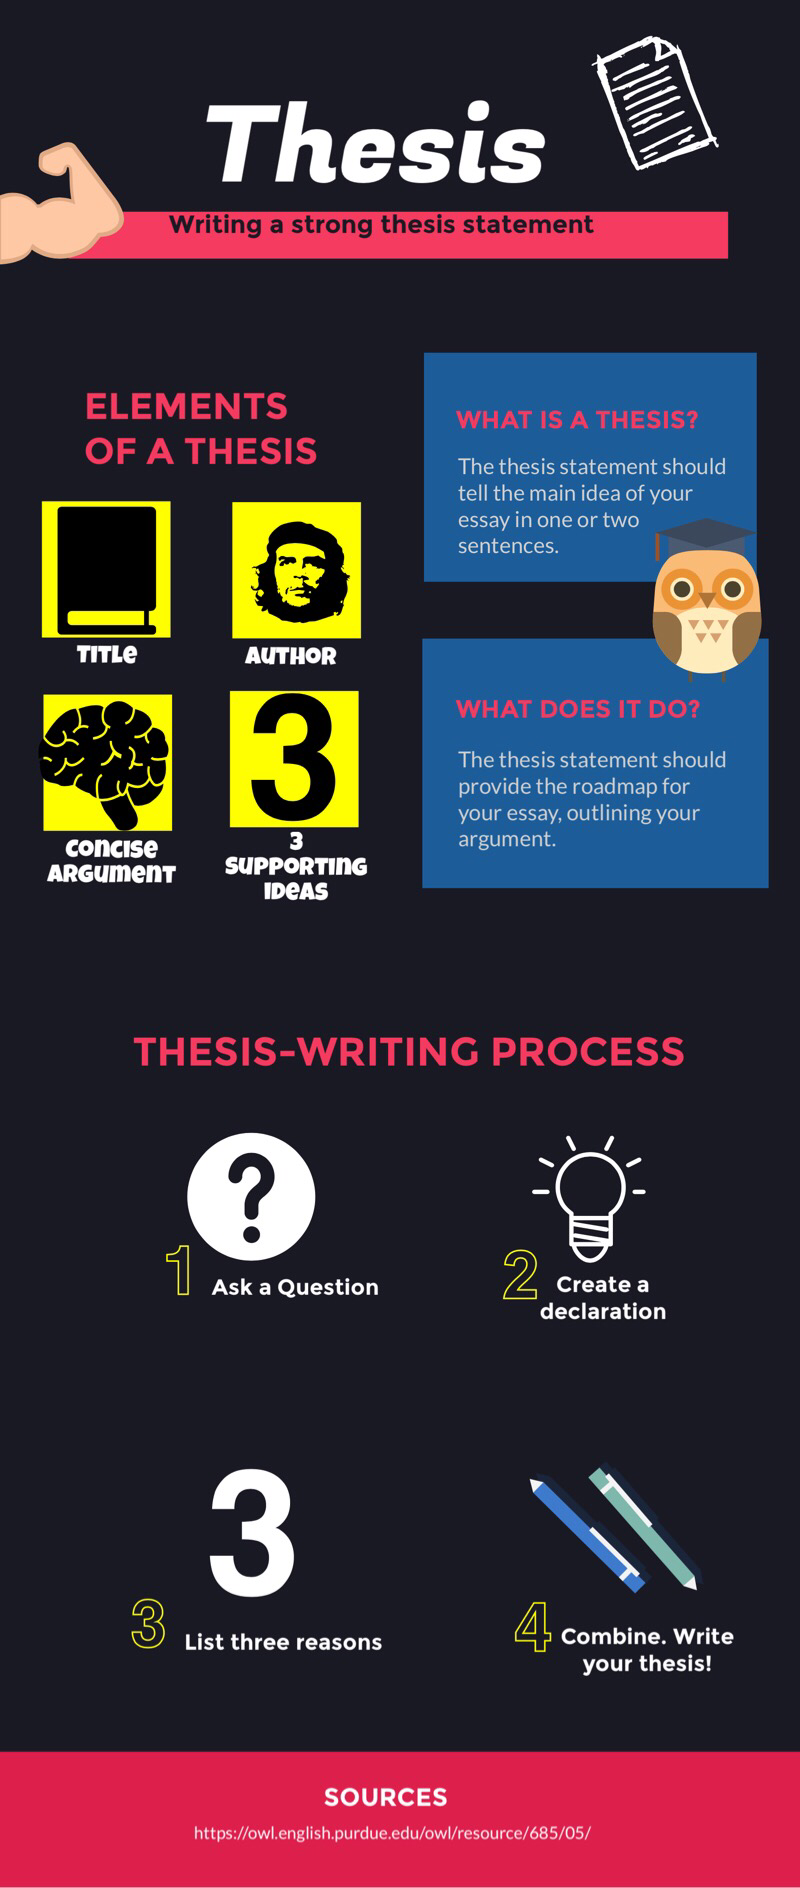
I used this app to make an infographic for my future Language Arts classroom about writing a thesis statement. I wanted to give students a visual example of the steps involved in making a strong thesis statement, the root of any strong essay. To start off, I searched through the templates available on Piktochart. They had quite of few of various templates but I chose a colorful one to appeal to high school students. After choosing a template, I was able to click on each element to edit it, including title, icons, photos, and text boxes. Selecting and editing each aspect of the infographic was easy, as was copying and pasting. The app had a ton of free icons available for use, which made me happy. One drawback of the app was the lack of a graph creator or something akin to that. Overall, this application was extremely user-friendly and aesthetically pleasing.
Using this application in the classroom would be quite easy and enjoyable. This could be used by the teacher, to create posters or graphics for the classroom, as they can easily be saved or exported to whatever media desired. Other options for infographics in the classroom can be found here. Another option would be assigning students to create one of their own using the application, either on their own or in groups. This would involve them researching their topic, creating graphs or other visual representations of data, and compiling their information in a visually appealing way. I think students would enjoy a project like this, which Uses technology and allows for creative freedom. I know I did.
I decided to make an infographic with the app Piktochart, a free app available on iPad, iPhone, android, and online. This app is described on the App Store as "This app comes with the essential functions to create, download and publish your own visuals. Features include: templates for creating infographics, posters, presentations and reports, ability to edit, save and publish your graphic through various media platforms, available customizable elements like text, photos, shapes, and icons." It is easy to use, with a built-in beginner tour that highlights the use of different tools and elements. A helpful tutorial on how to use this app can be found here.
I used this app to make an infographic for my future Language Arts classroom about writing a thesis statement. I wanted to give students a visual example of the steps involved in making a strong thesis statement, the root of any strong essay. To start off, I searched through the templates available on Piktochart. They had quite of few of various templates but I chose a colorful one to appeal to high school students. After choosing a template, I was able to click on each element to edit it, including title, icons, photos, and text boxes. Selecting and editing each aspect of the infographic was easy, as was copying and pasting. The app had a ton of free icons available for use, which made me happy. One drawback of the app was the lack of a graph creator or something akin to that. Overall, this application was extremely user-friendly and aesthetically pleasing.
Using this application in the classroom would be quite easy and enjoyable. This could be used by the teacher, to create posters or graphics for the classroom, as they can easily be saved or exported to whatever media desired. Other options for infographics in the classroom can be found here. Another option would be assigning students to create one of their own using the application, either on their own or in groups. This would involve them researching their topic, creating graphs or other visual representations of data, and compiling their information in a visually appealing way. I think students would enjoy a project like this, which Uses technology and allows for creative freedom. I know I did.
